Data Science
Midterm Review
Alessandro D. Gagliardi
Agenda:
- Review
- Regularization
- Lab
So Far:
- Intro to Data Science
- Python
- Relational Databases
- NoSQL
- APIs
- Probability and Statistics
- Linear Regression
- Logistic Regression and Choice Modeling
- Nine Decades of Machine Learning
- Cross Validation
- Bayes Theorem
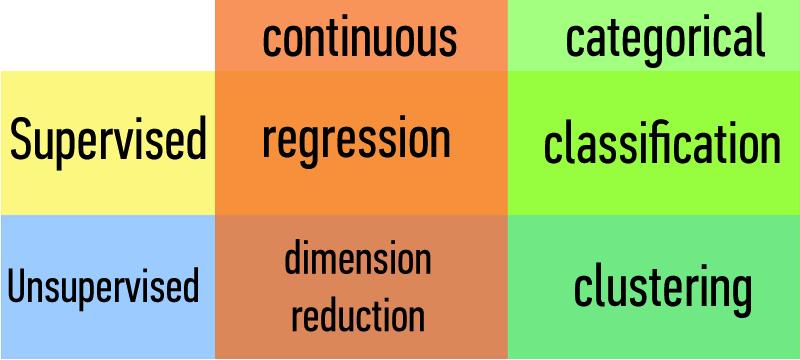
Data Science = Data + Science
Data can be:
- Unstructured (e.g. Email, Photos, Books, etc.)
- Semi-Structured (e.g. XML, JSON, NoSQL, APIs, etc.)
- Structured (e.g. SQL, Data Frames, etc.)
Science can be:
- Inferences / Predictions
- Statistical Tests (e.g. t-tests, ANOVA)
- Supervised Machine Learning (e.g. Linear Regression, Naïve Bayes, etc.)
- Explorations / Explanations
- Data Visualization (e.g. matplotlib)
- Unsupervised Machine Learning (e.g. PCA, clustering, etc.)
Data Science Workflow
From a Taxonomy of Data Science (by Dataists)
- Obtain
- Scrub
- Explore
- Model
- Interpret
Python
- open source: free! (both like beer and like speech)
- high-level: interpreted (not compiled)
- dynamic: things that would typically happen at compile time happen at runtime instead (e.g. dynamic typing)
- scripting language: "middle weight"
Third normal form (3NF)
"[Every] non-key [attribute] must provide a fact about the key, the whole key, and nothing but the key (so help me Codd)."
- Requiring existence of "the key" ensures that the table is in 1NF
- Requiring that non-key attributes be dependent on "the whole key" ensures 2NF
- Requiring that non-key attributes be dependent on "nothing but the key" ensures 3NF
CAP
- Consistency
- all nodes always give the same answer
- Availability
- nodes always answer queries and accept updates
- Partition-tolerance
- system continues working even if one or more nodes go down
CAP Theorem: Pick two
APIs
RESTful web API HTTP methods
| Resource | GET | PUT | POST | DELETE |
|---|---|---|---|---|
| Collection URI, such as http://example.com/resources | List the URIs and perhaps other details of the collection's members. | Replace the entire collection with another collection. | Create a new entry in the collection. The new entry's URI is assigned automatically and is usually returned by the operation. | Delete the entire collection. |
| Element URI, such as http://example.com/resources/item17 | Retrieve a representation of the addressed member of the collection, expressed in an appropriate Internet media type. | Replace the addressed member of the collection, or if it doesn't exist, create it. | Not generally used. Treat the addressed member as a collection in its own right and create a new entry in it. | Delete the addressed member of the collection. |
What is a regression model?
A functional relationship between input & response variables
A simple linear regression model captures a linear relationship between an input x and response variable y
$$ y = \alpha + \beta x + \epsilon $$
$y =$ response variable (the one we want to predict)
$x =$ input variable (the one we use to train the model)
$\alpha =$ intercept (where the line crosses the y-axis)
$\beta =$ regression coefficient (the model “parameter”)
$\epsilon =$ residual (the prediction error)
Choice Modeling:
Linear Probability Model (LPM)
- Easy to estimate and interpret (effect of parameters on probability is constant)
- Predicted probability is unbounded (not necessarily between 0 and 1)
Logistic Regression (Logit)
- Nonlinear relationship between parameters and estimates (logistic transform)
- Values are bounded between zero and one (more realistic)
What is a p-value?
What it's not:
- It is not the probability that the null hypothesis is true.
- It is not the inverse of the probability that the alternative hypothesis is true.
What it is:
- The p-value is the probability of an observed outcome if the null hypothesis were true.
N.B. Statistics is incapable of proving that anything is true. It can only suggest that something probably isn't.
What is Machine Learning?
from Wikipedia:
Machine learning, a branch of artificial intelligence, is about the construction and study of systems that can learn from data.”
"The core of machine learning deals with representation and generalization..."
- representation – extracting structure from data
- generalization – making predictions from data
Nine Decades of Machine Learning
(too much to even summarize but...)
A view of statistical data modeling:
optimize for: goodness-of-fit tests, residuals, etc.
A view of algorithmic modeling:
optimize for: predictive accuracy
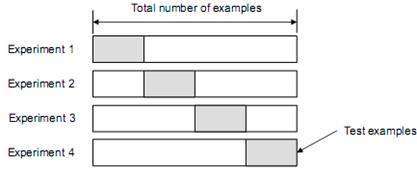
Cross Validation
- Randomly split the dataset into n equal groups
- Use partition 1 as test set & union of other groups as training
- Find generalization error
- Repeat steps 2-3 using different group as test set at each iteration
- Take average generalization error as estimate of OOS accuracy
Bayes Theorem
$P(AB) = P(A|B) \times P(B)\qquad$
$P(BA) = P(B|A) \times P(A)\qquad$ by substitution
But $P(AB) = P(BA)\qquad$ since event $AB =$ event $BA$
$\hookrightarrow P(A|B) \times P(B) = P(B|A) \times P(A)\>$ by combining the above
$\hookrightarrow P(A|B) = \frac{P(B|A) \times P(A)}{P(B)}\>$ by rearranging last step
Bayesian Inference
$$ P(C | x_1, \ldots, x_n) = \frac{P(x_1, \ldots, x_n | C) \times P(C)}{P(x_1, \ldots, x_n)} $$
In plain English the above equation can be written as
$$ \mbox{posterior} = \frac{\mbox{likelihood} \times \mbox{prior}}{\mbox{evidence}} $$
Make a simplifying assumption. In particular, we assume that the features $x_1, \ldots, x_n$ are conditionally independent from each other:
$$ P(x_1, \ldots, x_n | C) \approx P(x_1 | C) \times P(x_2 | C) \times \ldots \times P(x_n|C) $$
This "naïve" assumption simplifies the likelihood function to make it tractable.
Questions?
Regularization
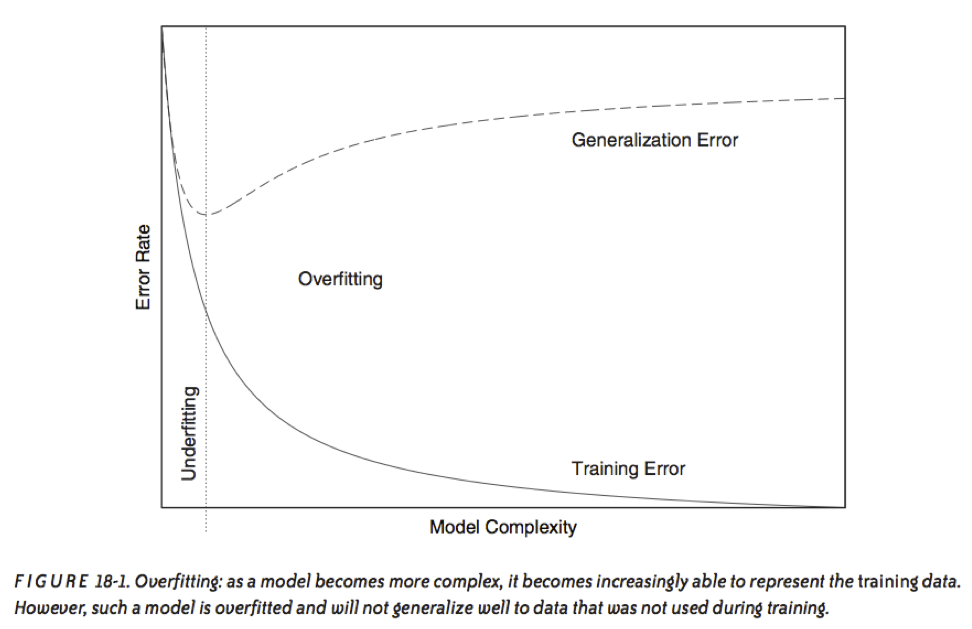
Recall our earlier discussion of overfitting.
It is a result of matching the training set too closely.
In other words, an overfit model matches the noise in the dataset instead of the signal.
 source: Data Analysis with Open Source Tools, by Philipp K. Janert. O’Reilly Media, 2011
Q: How do we define the complexity of a regression model?
A: One method is to define complexity as a function of the size of the coefficients.
Ex 1: $\sum |\beta_i|$
Ex 2: $\sum \beta_i^2$
Q: How do we define the complexity of a regression model?
A: One method is to define complexity as a function of the size of the coefficients.
Ex 1: $\sum |\beta_i| \leftarrow$ this is called the L1-norm
Ex 2: $\sum \beta_i^2 \leftarrow$ this is called the L2-norm
These measures of complexity lead to the following regularization techniques:
L1 regularization: $y = \sum \beta_i x_i + \epsilon$ such that $\sum |\beta_i| < s $
L2 regularization: $y = \sum \beta_i x_i + \epsilon$ such that $\sum \beta_i^2 < s $
Regularization refers to the method of preventing overfitting by explicitly controlling model complexity.
These regularization problems can also be expressed as:
L1 regularization: $ \min(||y - x\beta||^2 + \lambda ||x||) $
L2 regularization: $ \min(||y - x\beta||^2 + \lambda ||x||^2) $
This (Lagrangian) formulation reflects the fact that there is a cost associated with regularization.
LAB
In the DAT6 folder, from the command line:
git commit -am ...
git checkout gh-pages
git pull
git checkout personal
git merge gh-pages
ipython notebook
Then open DS_Lab10-Regularization